Showing posts with label regression. Show all posts

26 January 2014

Form Player Rater - Top Forwards Over the Last 10 Gameweeks


Forwards


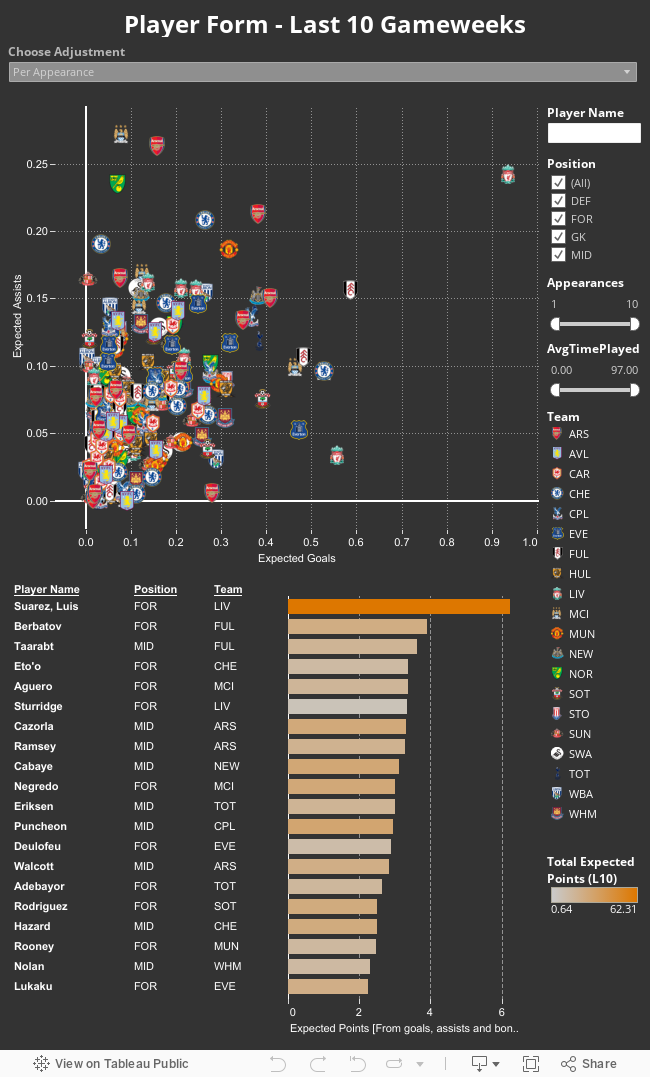
Suarez is essential, I don't need to say any more. Aguero might as well be (he's hidden under Eto'o in case anyone was wondering). With that done, we only have 1 forward slot left to consider, and the PR model throws up an odd name for this slot: Dimitar Berbatov.

Berbatov?


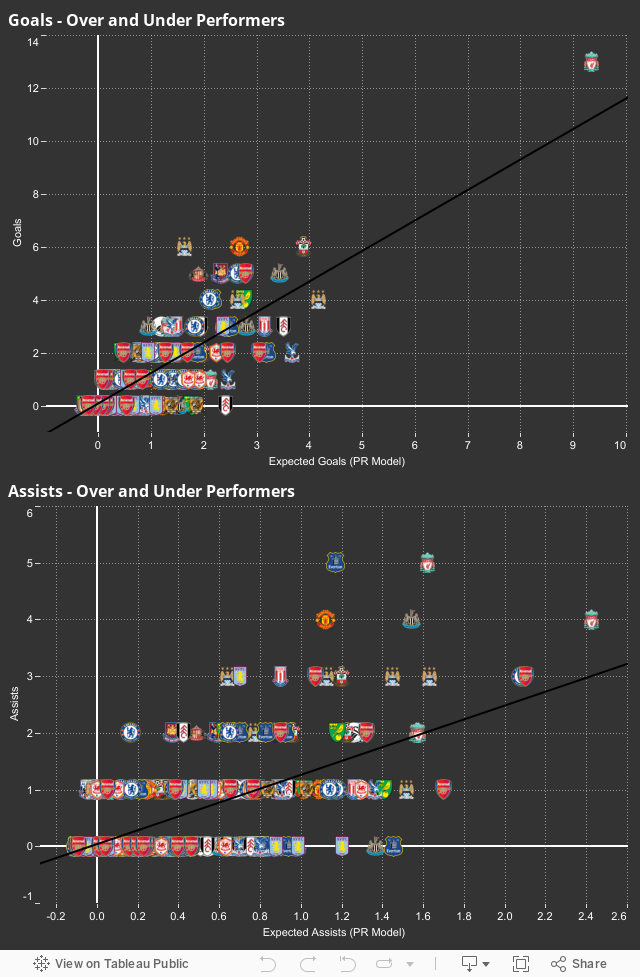
Bare with me on this one, Berbatov has some great stats. 11 shots on target in 6 appearances gives him a better SoT/game than all but Suarez and Sturridge, higher than Aguero, Eto'o and Negredo. In the same number of games he has 4 more shots on target than Adebayor does. Yes, he's not in form, and yes Fulham are one of the worst teams in the league. But don't let the absence of goals fool you that he's not been attacking. Puncheon for example hadn't scored up until 3 games ago, but his shooting stats were brilliant. Since then he's scored 2, and would have had a third if he didn't sky a penalty. Similar story with Cazorla. I want to emphasise that past shooting stats are a better predictor of future goal scoring, than past goal scoring is. And Berbatov's shooting numbers make him a good consideration.

However, I think this shows a flaw in the model I need to address. Berbatov is here by virtue of a brilliant shot accuracy, otherwise he'd be much lower down the list, and I think this is something the model overvalues. To give you a quick insight into the model, shots off target really hurt a players goal expectations. My theory behind this is that a shot off target has no chance of becoming a goal, but it also means a player gives up an opportunity to have a shot ON target, which may go in. A shot off target is a wasted opportunity, so players who waste a lot of opportunities should score fewer than those who don't. Berbatov is pretty efficient with his opportunities. Having said that, Berbatov is may not be the 2nd best choice in FPL, but he may well be in the top 10. His performances last year showed he can be a true fantasy asset as well.

Using the Per Minute adjustment rather than the Per Appearance one might also be more fair here, since many top strikers are returning from injury and have made sub appearances as a result. Aguero and Sturridge are two noticeable examples of this. When we do this, a top 4 stand out: Suarez, Aguero, Sturridge and Eto'o, the last of whom would make a very nice punt if you think he'll start more games with Torres out. Long term PR model favourite Lukaku really has sunk away recently and is one to ditch at the moment.

My Watchlist


Assuming you have Suarez and Aguero, here's how I'd rank the contenders for the 3rd forward slot:

Top Tier: Sturridge, Negredo
Next Tier: Adebayor, Rooney, Eto'o, Berbatov
Cheap (but good) options: Rodriguez, Dzeko, Bony
Lagging Behind: Welbeck, Lukaku, Remy, Benteke, Giroud

If your on your WC and debating the 3rd forward slot, I'd go for Sturridge or Negredo first. If you understandably don't want to get two strikers from the same team, then I'd go for Adebayor or Rooney, and if you fancy a punt then Eto'o or Berbatov could be lucrative differentials. If you want to save money to upgrade elsewhere then I think Jay Rodriguez is your man, he has stat lines to compete with 7-8m priced forwards and is a great budget pick. Finally, the likes of Lukaku, Giroud and Remy are old favourites, but haven't quite matched their competitors recently. They make reliable picks and have the potential to increase their fortunes soon, but they wouldn't be top of my list right now.

25 January 2014

Form Player Rater - Top Performers Over the Last 10 Gameweeks?

Back in December I used the Player Rater model to have a look at who the best recent performers had been and it proved a popular post so I'm doing another one! This time I'm looking at the last 10 gameweeks instead, by including more games we get a slightly better representation of the players medium-long term performance, so we don't just look at who's had 1 or 2 great games (like Adam Johnson)

Below are the two PR model graphics, but they only include data from the last 10 gameweeks (13-22), over the next few days I'll have an article for each position, starting with the forward position tomorrow.


The format should be familiar, but the filters on the side now apply to both the scatter diagram and bar chart, which should make things a bit easier. If anyone has any questions on this, and how the PR model works, don't hesitate to ask me. Best place to get ahold of me is on Twitter @The_First_Touch.


Over/Under-Performers


I also created an updated diagram for over/under-performers according to the model. You can find an explanation of what these show here, but the general idea is that if someone is way above the trendline shown, then they have been fortunate to get as many goals/assists as they have and we can expect them to regress soon. If they are way under the line then they have been unlucky in their efforts so far, and we might expect more points from them in future.


Again, if any disagrees with the model then I'd love to hear your thoughts and how I could improve the model and graphics.

16 October 2013

Explaining Yellow Cards in the Premier League


For this post I'm going to look at an often overlooked aspect of fantasy football: yellow cards. We often chase those elusive goal and assist points but pay little attention to those -1 points from cautions, only taking action when a player is suspended. This post seeks to explain yellow cards and see if there's any players this year we might want to avoid.

The Yellow Cards Model

Using data from the 2012/13 Premier League season I built a regression model to try and explain what factors determine how many cards a player picks up. I choose to focus on yellows alone because straight reds are too rare an occurrence to explain and are just as likely to be given for unforeseen events (Hazard's ball boy incident) as for bad tackles. Cautions are usually given for reckless fouls (though are also awarded for diving, unsportsmanlike behaviour etc.) and so are better suited for analysis. After playing around I settled on a model where I regressed yellow cards received on 3 variables: errors leading to chances, fouls conceded and tackles.

The estimated model is:

YellowCards=0.161errors_leading_to_chance+0.086fouls_conceded+0.018tackles

(All variables are significant at a 5% level, the intercept is not)

For the lay person, this equation allows us to calculate how many cards we might expect a player to receive given how many errors, fouls and tackles they've committed. For example, Fellaini made 95 tackles, commited 81 fouls and had 3 errors, so we expect him to pick up 9.16 YC over the season. He actually received 9.

The correlation for the model is 0.79 (R2=0.62, so 62% of the variation in yellow cards can be explained by the model).

Below is a plot of expected yellow cards vs actual yellow cards. We see a strong positive relationship, which is encouraging for the model.


Comments on the Model

The model is not revolutionary, it says the more tackles, fouls and errors a player concedes the more cards they are likely to pick up. It does however give exact estimates of how these variables translate to cards.
Some first impressions:
  • Overall the model shows a good fit and an expected yellow card translate almost 1:1 to a received yellow card.
  • There's a lot of variation, but this to be expected since we are only really explaining yellow cards awarded for fouls and challenges. There's also variation between referees strictness, as well as variation within each referees to award cards for a given challenge (a ref might see two identical tackles but only give a YC for one and not the other).

The model is also useful for identifying those who are anomalies in the model and have an excessive avoidance/attraction (clean/dirty) to cards.

Avoiding Cards (received fewer cards than expected):

  • Routledge, Berbatov, Diame, Kone, Ba, Sessegnon, Arteta, Oscar.

  • These are players who are either excellent at making tackles, or only commit minor fouls. It may also be they are good at getting away with fouls! There's also a large element of luck here. They seem to be more attacking players so their fouls are more likely to be minor infringements. They are also players with good reputations, so referees may be letting them get away with more.
Attracting Cards (received more cards than expected):

  • Perch, Whitehead, Collins, Williamson, Caldwell, Suarez, N'Zonzi, Shawcross,  Lowton, Scholes.

  • Again, luck plays a huge part here, but all these players seem to have a reputation for being 'determined' tacklers. Perhaps the fouls they commit are more likely to result in cards, or maybe refs are quicker to punish them, probably a bit of both. Suarez stands out in particular, his cards for diving causing the problem here. Again, we are only really explaining cards from tackles here and not dives, unsportsmanlike behaviour, excessive celebrations etc.
From these two groups we see that defenders appear to be underestimated in the model, while attackers are overestimated. Simply, a foul or tackle committed by a defender is more likely to draw a yellow card. This is understandable given the nature of fouls attackers will commit, and their position on the field when committing them. I'd love to be able to split the data by position and see if this is true, unfortunately I don't have that data available.


Applying the Model (Use for FPL)

We can then take this model and what we've learnt and apply it to this years data and see who is most likely to have picked up cards this year. This is going to be the application of the model to FPL. Looking at expected yellow cards is going to give a better view of those card-prone players than looking at cards themselves which are more likely to be affected by random variation so far this season. The graphic below shows the 50 players with the highest expected cards, along with their number of cards they've actually picked up.


(Note, the values aren't adjusted for minutes, they are totals)

We see Wanyama sitting pretty at the top with 2.138 expected YC, he's been rewarded 2 so the model looks good for this year too. Van Wolfswinkle has been lucky not to receive a YC so far (though remember we said that the model overestimates cards for forwards). Most important to fantasy interests are Ramsey, Noble and Zabaleta, who are on course to pick up 10 YCs over the season, making them dangers at reaching the 1 game ban for 5 yellows. Rooney also ranks highly, though I wouldn't worry about him picking up enough for a ban. Ivanovic at 16th is also interesting, we know yellows negatively affect BPS, so Ivanovic's propensity to cards gives even more reason to favour Terry who seems a bonus darling so far this year.

Conclusion

In conclusion, we can create a pretty good model for explaining how defensive work translates into yellow cards. For the small amount of data I have I'm fairly happy with the results, despite large variation in the data. However it's clear the model underestimates defenders and overestimates strikers, fouls committed by defenders are more likely to pick up yellows. If I develop this model I'll look more closely at that. The model must also be complemented with knowledge about players tendencies and temperament to offer a better overall explanation of yellow cards.

As for FPL, it's worth checking these charts to see if your transfer targets or current players are likely to pick up cards and use that as part of your decision making.I hope those with models that forecast FPL points might be able to build this into their model, and those with bonus points model's might factor it in as well.

This is my first real attempt at an article, so I'd love to hear comments below or via Twitter @The_First_Touch.

Edit (08/11/13)

It turns out that Mark Taylor has already written a brilliant and in-depth piece on How Fouls Turn into Cards and I highly recommend you head over and read his article.