
For this post I'm going to look at an often overlooked aspect of fantasy football: yellow cards. We often chase those elusive goal and assist points but pay little attention to those -1 points from cautions, only taking action when a player is suspended. This post seeks to explain yellow cards and see if there's any players this year we might want to avoid.
The Yellow Cards Model
Using data from the 2012/13 Premier League season I built a regression model to try and explain what factors determine how many cards a player picks up. I choose to focus on yellows alone because straight reds are too rare an occurrence to explain and are just as likely to be given for unforeseen events (Hazard's ball boy incident) as for bad tackles. Cautions are usually given for reckless fouls (though are also awarded for diving, unsportsmanlike behaviour etc.) and so are better suited for analysis. After playing around I settled on a model where I regressed yellow cards received on 3 variables: errors leading to chances, fouls conceded and tackles.The estimated model is:
YellowCards=0.161errors_leading_to_chance+0.086fouls_conceded+0.018tackles
(All variables are significant at a 5% level, the intercept is not)For the lay person, this equation allows us to calculate how many cards we might expect a player to receive given how many errors, fouls and tackles they've committed. For example, Fellaini made 95 tackles, commited 81 fouls and had 3 errors, so we expect him to pick up 9.16 YC over the season. He actually received 9.
The correlation for the model is 0.79 (R2=0.62, so 62% of the variation in yellow cards can be explained by the model).
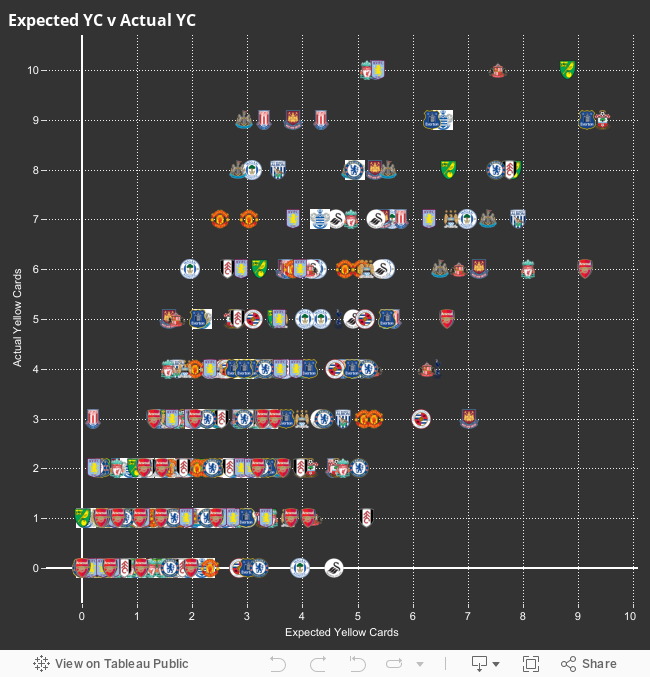
Below is a plot of expected yellow cards vs actual yellow cards. We see a strong positive relationship, which is encouraging for the model.
Comments on the Model
The model is not revolutionary, it says the more tackles, fouls and errors a player concedes the more cards they are likely to pick up. It does however give exact estimates of how these variables translate to cards.Some first impressions:
- Overall the model shows a good fit and an expected yellow card translate almost 1:1 to a received yellow card.
- There's a lot of variation, but this to be expected since we are only really explaining yellow cards awarded for fouls and challenges. There's also variation between referees strictness, as well as variation within each referees to award cards for a given challenge (a ref might see two identical tackles but only give a YC for one and not the other).
The model is also useful for identifying those who are anomalies in the model and have an excessive avoidance/attraction (clean/dirty) to cards.
Avoiding Cards (received fewer cards than expected):
- Routledge, Berbatov, Diame, Kone, Ba, Sessegnon, Arteta, Oscar.
- These are players who are either excellent at making tackles, or only commit minor fouls. It may also be they are good at getting away with fouls! There's also a large element of luck here. They seem to be more attacking players so their fouls are more likely to be minor infringements. They are also players with good reputations, so referees may be letting them get away with more.
- Perch, Whitehead, Collins, Williamson, Caldwell, Suarez, N'Zonzi, Shawcross, Lowton, Scholes.
- Again, luck plays a huge part here, but all these players seem to have a reputation for being 'determined' tacklers. Perhaps the fouls they commit are more likely to result in cards, or maybe refs are quicker to punish them, probably a bit of both. Suarez stands out in particular, his cards for diving causing the problem here. Again, we are only really explaining cards from tackles here and not dives, unsportsmanlike behaviour, excessive celebrations etc.
Applying the Model (Use for FPL)
We can then take this model and what we've learnt and apply it to this years data and see who is most likely to have picked up cards this year. This is going to be the application of the model to FPL. Looking at expected yellow cards is going to give a better view of those card-prone players than looking at cards themselves which are more likely to be affected by random variation so far this season. The graphic below shows the 50 players with the highest expected cards, along with their number of cards they've actually picked up.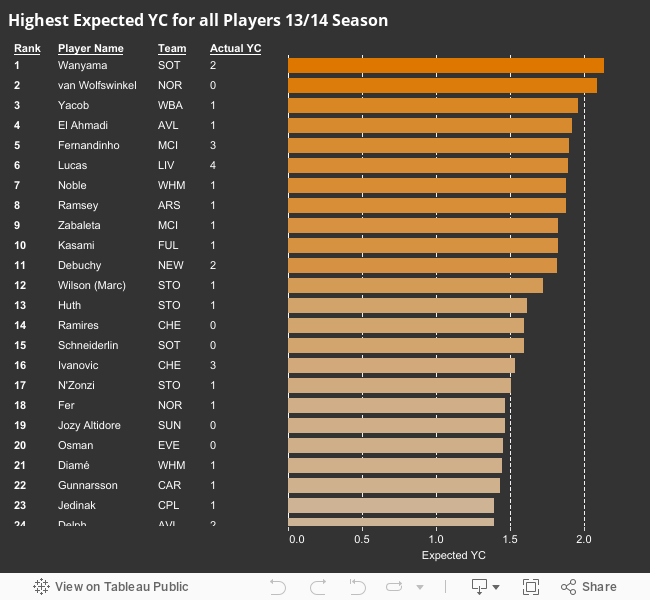
We see Wanyama sitting pretty at the top with 2.138 expected YC, he's been rewarded 2 so the model looks good for this year too. Van Wolfswinkle has been lucky not to receive a YC so far (though remember we said that the model overestimates cards for forwards). Most important to fantasy interests are Ramsey, Noble and Zabaleta, who are on course to pick up 10 YCs over the season, making them dangers at reaching the 1 game ban for 5 yellows. Rooney also ranks highly, though I wouldn't worry about him picking up enough for a ban. Ivanovic at 16th is also interesting, we know yellows negatively affect BPS, so Ivanovic's propensity to cards gives even more reason to favour Terry who seems a bonus darling so far this year.
Conclusion
In conclusion, we can create a pretty good model for explaining how defensive work translates into yellow cards. For the small amount of data I have I'm fairly happy with the results, despite large variation in the data. However it's clear the model underestimates defenders and overestimates strikers, fouls committed by defenders are more likely to pick up yellows. If I develop this model I'll look more closely at that. The model must also be complemented with knowledge about players tendencies and temperament to offer a better overall explanation of yellow cards.As for FPL, it's worth checking these charts to see if your transfer targets or current players are likely to pick up cards and use that as part of your decision making.I hope those with models that forecast FPL points might be able to build this into their model, and those with bonus points model's might factor it in as well.
No comments:
Post a Comment