
Below are the two PR model graphics, but they only include data from the last 10 gameweeks (13-22), over the next few days I'll have an article for each position, starting with the forward position tomorrow.
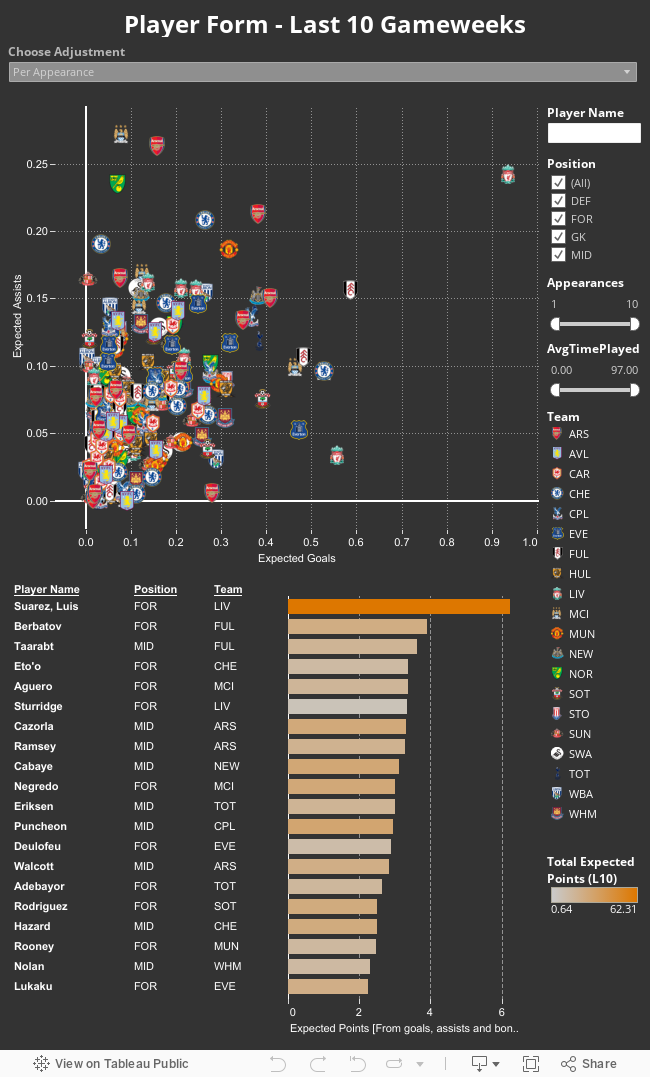
The format should be familiar, but the filters on the side now apply to both the scatter diagram and bar chart, which should make things a bit easier. If anyone has any questions on this, and how the PR model works, don't hesitate to ask me. Best place to get ahold of me is on Twitter @The_First_Touch.
Over/Under-Performers
I also created an updated diagram for over/under-performers according to the model. You can find an explanation of what these show here, but the general idea is that if someone is way above the trendline shown, then they have been fortunate to get as many goals/assists as they have and we can expect them to regress soon. If they are way under the line then they have been unlucky in their efforts so far, and we might expect more points from them in future.
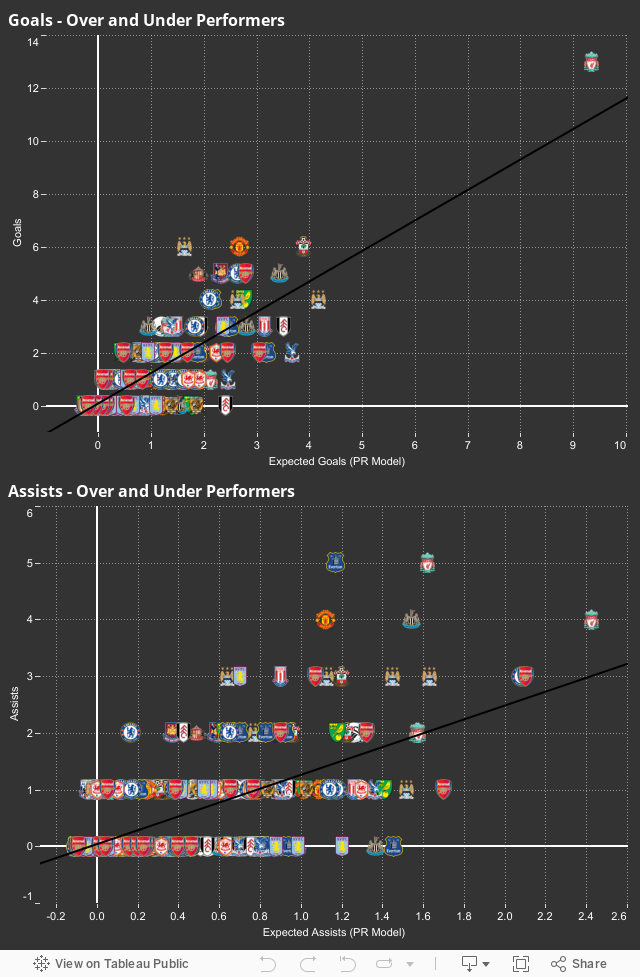
Again, if any disagrees with the model then I'd love to hear your thoughts and how I could improve the model and graphics.
No comments:
Post a Comment